The Curve Stats Report command summarizes every curved track's radius across the whole layout: total curve count, the minimum, maximum, and mean radius, and a histogram bucketing every curve into one of five radius ranges (under 12in, 12-18in, 18-24in, 24-36in, and over 36in, model-scale inches). The minimum radius is the single most useful number here – it determines which locomotives and passenger cars will operate reliably on the layout.
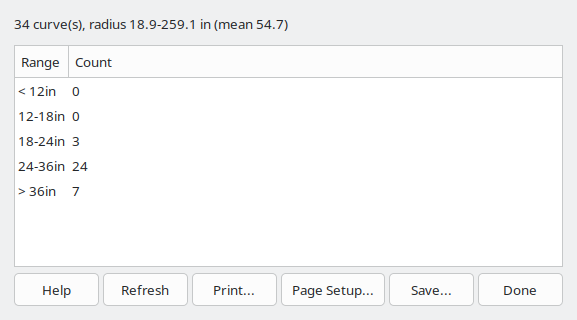
A summary line above the list gives the curve count and radius range, updated whenever the report is generated or refreshed.
Unlike the Parts List (Parts List) command, this report always covers the whole layout; it does not consider the current selection (Select). Like the Turnout Density Report (Turnout Density Report), this report has no click-to-navigate – it's a layout-wide statistic, not a list of specific locations to visit.
The Refresh button recomputes the report in place – useful after changing curves elsewhere in the layout, without closing and reopening the report window.
The Save As... button opens a File Save dialog window that's used to name and save the report to a text file.
The Print button opens the Print dialog which is used to print the report.
The Filter... button (Filter Layers/Groups) opens a dialog to scope this report to specific Layers/Groups (Layer Groups Dialog) – every layer is included by default.
The Done button closes the Curve Stats Report window.