The Gaps Report command lists pairs of open (unconnected) track endpoints, on two different tracks, that lie within the layout's Connection Distance preference (Options > Preferences Dialog) of each other – the same distance the editor itself uses to decide whether two endpoints are close enough to connect. Each row gives Track A and Track B with each one's own layer (Layer #/Layer Name), and the Gap between them in inches. A pair like this usually means a missed connection rather than two deliberate dead ends – but check both sides' layers first: on a multi-level layout, two endpoints can sit at the same X/Y position in the shared 2D drawing while actually being on two different physical levels, in which case the "gap" isn't a real one.
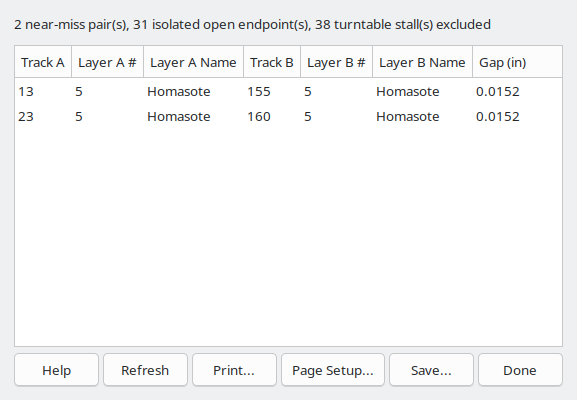
A summary line above the list gives the number of near-miss pairs found, how many open endpoints have no nearby partner (isolated), and how many endpoints were excluded because they belong to a turntable, updated whenever the report is generated or refreshed.
Turntable stall endpoints are always open by design and are excluded from this report's pairing analysis entirely – they're counted in the summary line but never listed as a gap. This is a deliberate difference from the Unconnected Endpoints Report (Unconnected Endpoints Report), which lists every open endpoint including turntable stalls.
Isolated open endpoints (no nearby partner) are not listed in the interactive table – they're counted in the summary line, and listed in full in the Save/Print output.
Unlike the Turnout Density Report (Turnout Density Report) and the other phase-2 reports, this report always covers the whole layout and is interactive, the same way the Unconnected Endpoints Report (Unconnected Endpoints Report) is: selecting a row pans the Main Canvas (Main Window Overview) to the midpoint between the pair and draws a temporary open-circle indicator there. The indicator is purely visual – it's never saved with the layout and disappears as soon as the report window closes. Its color can be changed on the Colors (Colors Dialog) dialog, under Report Indicator.
The Refresh button recomputes the report in place – useful after fixing a flagged gap elsewhere in the layout, without closing and reopening the report window.
The Save As... button opens a File Save dialog window that's used to name and save the report to a text file.
The Print button opens the Print dialog which is used to print the report.
The Filter... button (Filter Layers/Groups) opens a dialog to scope this report to specific Layers/Groups (Layer Groups Dialog) – every layer is included by default. A filtered-out endpoint is excluded from pairing entirely, so a pair only appears when both its endpoints' layers are included.
The Done button closes the Gaps Report window.